News
Field and CPL Updates
2011 Core Processing Line
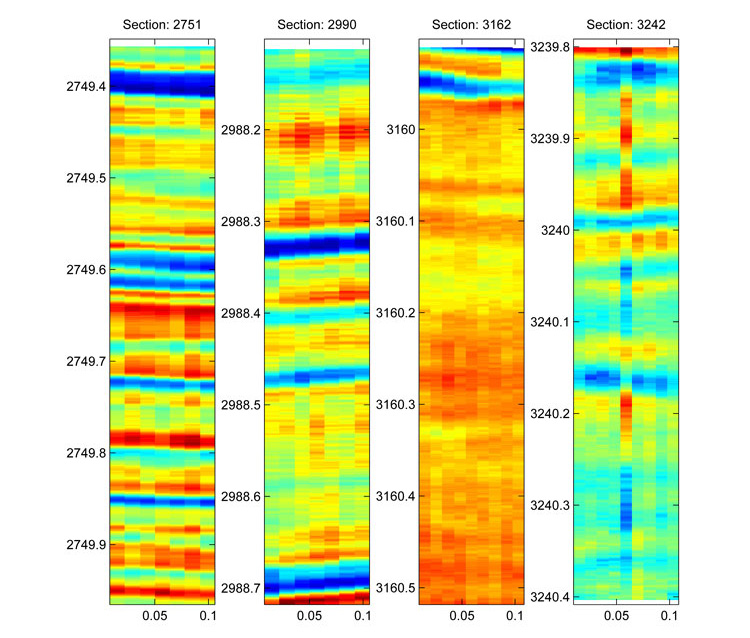
Multi-track electrical conductivity plots showing the progression of electrical stratigraphy downcore in the WAIS Divide ice core. Axes are in meters, upcore is at the top of the image. Warm colors represent high electrical conductivity, cold colors low conductivity. Each track is normalized individually, so colors indicate a relative magnitude and cannot be compared between sections.
In general, layers become less distinct with depth, as the amplitude of the variations in conductivity decreases and noise becomes more apparent in the multi-track plots. The dip angles of layers cannot be directly compared between cores because of uncertainty in the orientation of the core as it is processed.
The two lower sections show disruptions to the stratigraphy on a centimeter to decimeter (annual to decadal) scale:
Section 3162: The blue layer at 3159.95 appears to be wavy and "pinched out". This layer is a large decrease in conductivity, so the layering below it is indistinct due to the normalization process.
Section 3242: Layers dip in different directions; layers above 3240.1 slant up from left to right while layers below 3240.1 slant down from left to right.
The WAIS Divide ice core has now been processed to a depth deeper than the EPICA Dome C ice core (3270 m), with just under 50 meters of ice left to process. We ended the week at a depth of 3282 meters of 3331 meters in total. Naturally, as we enter our last week on the CPL, there is excitement all around at the prospect of completing such a monumental task. Everyone's involvement in this project over the last few years has been critical in getting to where we are today. There has been hard work contributed by many in the field, labs, and offices.
Unfortunately, there are still months (and years...) of work left until we see many of the scientific results from the WAIS Divide project. However, we do a little bit of science here on the CPL, and it so happens that the deep ice processed in the last week has shown some interesting features. TJ Fudge (UW) yet again provides us with a science tidbit this week, as his multi-track electrical conductivity measurements suggest some ice flow-related alteration of the stratigraphy within the ice core.
These "multi-track" images are a compilation of tracks made along the length of each core section. Each track is at a different position across the core, allowing a 2-D view of the electrical stratigraphy for a 10 cm plane along the entire ice core. This technique visually illustrates the stratigraphy in the center of each section of the ice core.
Additionally, a visible layer at a depth of approximately 3231 meters shows significant variation in dip angle across the 12-centimeter cross-section of the ice core (see photo below). While originally deposited horizontally on the surface of the ice sheet, visible layers of volcanic ash or dust are incorporated into the ice and their orientation altered by ice flow. At depths in the middle of the ice sheet, these layers are often slightly inclined. As ice nears the base of the ice sheet more complex ice flow can alter and sometimes fully disrupt the original horizontal stratigraphy required to clearly interpret records of climate in ice cores.
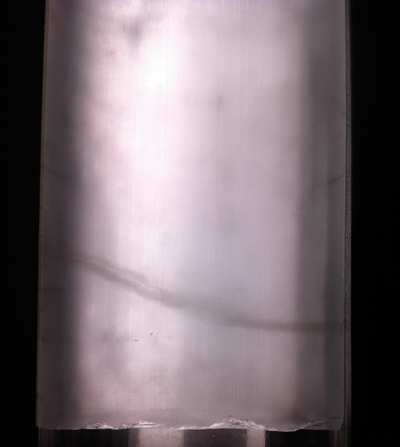
Photo: A section of the ice core, approximately 3231 meters deep, with a visible layer that exhibits considerable flow-alteration. Stratigraphic "up" is at the top of the photo. The diameter of the ice core is 12 centimeters. Photo credit: Peter Neff
